


Mobile Marketing Statistics compilation
Statistics on consumer mobile usage and adoption to inform your mobile marketing strategy mobile site design and app development
"Mobile to overtake fixed Internet access by 2014" was the huge headline summarising the bold prediction from 2008 by Mary Meeker, an analyst at Kleiner Perkins Caufield Byers who reviews technology trends annually in May.
The mobile statistics that the team at Smart Insights curate in the regular updates to this article include:
- Ownership of smartphone vs Desktop
- Mobile vs desktop media and website use
- Mobile advertising response
- Smartphone vs Tablet vs Desktop conversion rates
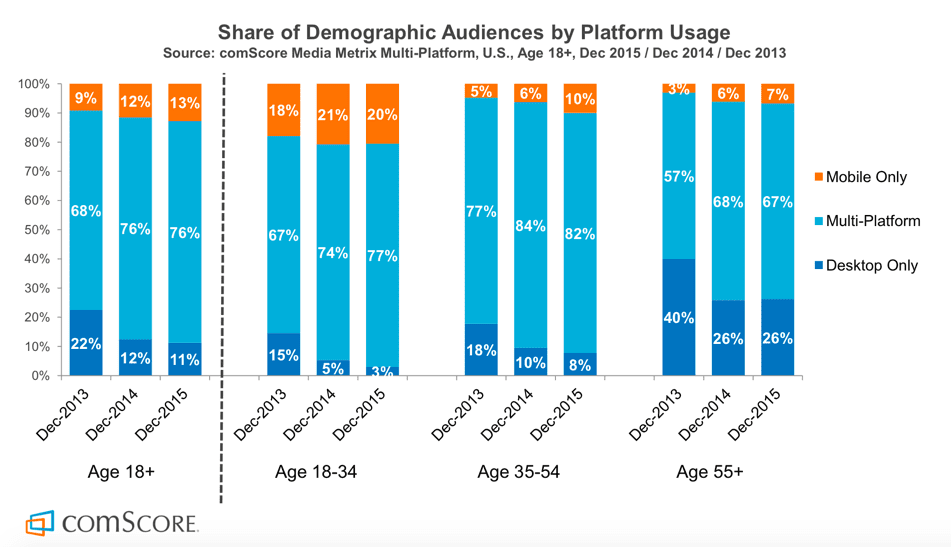
Well, we're now past the mobile Tipping Point as this report from comScore shows. So it's no longer a case of asking whether mobile marketing important, we know it is! It's now a question of using the statistics to understand how consumers behave when using different types of mobile devices and what their preferences are.
To help you keep up-to-date with the rise in consumer and company adoption of mobile and its impact on mobile marketing, I will keep this post updated throughout 2016 as the new stats come through to support our 120 page Expert members Ebook explaining how to create a mobile marketing strategy. We also have this free summary mobile strategy briefing for Basic members.
Our Mobile Marketing Strategy Briefing explains the key issues to plan for in mobile marketing.
Download our Free Mobile Marketing Guide.
We have grouped the latest mobile stats under these headings for key questions marketers need to answer about mobile to help them compete:
- Q1. Time spent using mobile media
- Q2. Percentage of consumers using mobile devices
- Q3. How many website visits are on mobile vs desktop devices?
- Q4. Mobile device conversion rates and visit share for Ecommerce sites?
- Q5. Mobile - app vs mobile site usage?
- Q6. How important are mobile ads
OK, let's go!
Q1. How much time do consumers spend using mobile media?
Mobile media use varies through the day. This is important to understand for dayparting, i.e. buying AdWords and display media.This research from comScore Global Digital Future in Focus shows how desktop is still important for daytime at work audiences, but Tablet and smartphone dominate in the evening.
The latest figures, also from comScore Mobile Metrix presented in the OfCom Communications Market report show the total browse time per month is much higher on smartphones - these figures compare to 34 hours and 29 hourse for the United States and United Kingdom on desktop.
Mary Meeker's annual spring updates on mobile are a must-read if you follow consumer adoption of technology platforms, so we have used some of the key findings from the latest KPCB mobile technology trends by Mary Meeker. Her deck is nearly 200 slides, so we have selected the statistics which best summarise the importance of mobile devices today.
The latest data shows that we are now well past the tipping point mentioned at the top of this post. Mobile digital media time in the US is now significantly higher at 51% compared to desktop (42%).
The implications are clear - if you're not able to reach your audience through mobile search or display, or you're not providing a satisfactory mobile experience you will miss out compared to competitors who are.
Q2. Percentage of consumers using mobile devices?
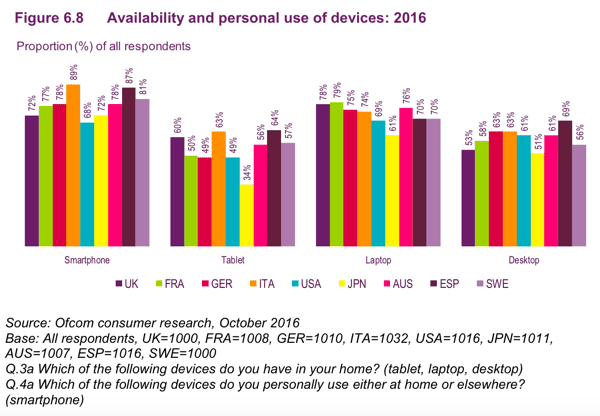
This Ofcom international benchmark shows the global popularity of using different digital devices in representative countries.
This interesting visual from comScore also part of their digital future in focus shows the picture that marketers need to build up. This panel data shows that the majority of consumers are multiplatform and will often be multi-screening, accessing sites on mobile or desktop, so consistent experiences across device need to be deployed.
You need to answer this for your own site. As Rob Thurner explained in his post on KPIs to review m-commerce effectiveness, it's important to keep track of the split between users of mobile and desktop devices visiting your site(s). Using segments in Google Analytics is the best way to do this.
Q3. How many website visits are on mobile vs desktop devices?
However, we need to be careful with interpreting data on hours spent, since we spend most of our time on smartphones checking email and using social media. This has led to the common mantra of 'Mobile-First' design which I think is dangerous, or at least oversimplistic! Eric Schmidt, then Chairman of Google talked about a Mobile-First approach. The reality is that while smartphone use is overwhelmingly popular for some activities such as social media, messaging and catching up with news and gossip, the majority of consumers in western markets also have desktop (and tablet) devices which they tend to use for more detailed review and purchasing. So we need to think about strategies to engage what comScore call the Multichannel Majority not simply 'mobile first' or 'smartphone adoption'. This explains why mobile conversion rates are much lower in retail and why the breakdown between traffic for retail sites is broadly equal between smartphone and desktop. Audience measurement platform comScore has talked for some time about strategies to engage and measure the multiplatform majority across devices and I think there will, or should be more focus on that in the years ahead.
This UK data also shows the importance of the multichannel majority in sectors like Retail and to a lesser extent banking, but that for some niches like weather 'mobile first' is more accurate.
Their latest data for the US is striking in shows how the multi-device majority dominate, particularly amongst millenials.
Although mobile is growing in importance, this older data from Adobe's latest Digital Index (not updated yet) shows that in all industries the majority of visits are still on desktop.
So with so many site visits still on desktop, it's important when designing using a responsive web design that the desktop experience isn't degraded and this has led to many larger businesses using an adaptive web design where layout and content are tailored for desktop, tablet and smartphone screen dimensions.
Q4. Mobile device conversion rates and visit share for Ecommerce sites?
We have a separate compilation of Ecommerce conversion stats if you're creating a business case for mobile optimised sites as explained in our mobile marketing strategy guide, this data is also valuable since it shows the variation in conversion rate by mobile type. This is the latest data from Monetate for their retail clients showing conversion rates.
Their latest quarterly update from November 2016 shows conversion rates to add-to-basket or cart and below sale across the last 4 quarters, up to the Q3 2016:
The data clearly shows that Smartphone conversion rates are much lower than for desktop - important if you're making the business case for a mobile responsive site.
This source is useful since it's a regular survey showing the growth in use of mobile site visitors. enables you to drill down to see usage by device type, for example iPad is still the dominant tablet, but Kindle Fire and Android tablets now account for over 10% of tablets. You can see that tablet and smartphone use nearly doubled in the year based on 500 million plus visits for these retail clients (see link above for methodology).
Q5. Mobile media time - app vs mobile site usage? App usage (90% of time) dominates browsers in mobile usage
Consumer preference for mobile apps vs mobile sites should also be thought through as part of mobile strategy.
Today, the latest data from Yahoo's Flurry analytics shows that 90 percent of consumer's mobile time is spent in apps. As they put it: It’s an App World. The Web Just Lives in It. This is a key insight as companies decide whether to develop mobile apps or create mobile device specific apps.
This 90% figure is a key insight as companies decide whether to develop mobile apps or restrict themselves to mobile optimised sites. You do have to be careful about interpreting this since, as the chart below shows, Facebook, messaging, games and utility apps will naturally have the greatest time spent and browser use is still significant by volume if not proportion. But this has implications for advertising on mobile to reach consumers using apps like Facebook and Gmail.
 Q6. Mobile Ad Spend still lags behind Mobile Media Consumption
So, how have advertisers responded to the change in mobile media time? The next chart shows that despite the growth in media time above, some advertisers are missing out since the right-most bar shows that there is a huge missing opportunity on mobile advertising
This research sourced from a 2015 study by eMarketer into mobile ad budgets shows a different view. In 2015 mobile ad spending accounts for 49% of digital ad spending, which is only slightly behind the trends of how people are using their devices. These stats also show projections for future growth, which is important as it shows where the market is going. It is clear that mobile is the future, and within 3 years it will come to dominate digital ad spending.
| 2015 | 2016 | 2017 | 2018 | 2019 | |
|---|---|---|---|---|---|
| Mobile Ad spending- Billions $ | 28.7 | 40.5 | 49.8 | 57.7 | 65.8 |
| Percentage change | 50% | 41% | 23% | 16% | 14% |
| Percentage of digital ad spending | 49% | 60.4% | 66.6% | 69.7% | 72.2% |
Q7. How consumers research products using mobile search and review sites
Google's mobile path to purchase report surveyed 950 US consumers across 9 different verticals (Restaurants, Food & Cooking, Finance, Travel, Home & Garden, Apparel & Beauty, Automotive, Electronics, Health & Nutrition) to assess how they researched purchases via mobile. A key finding is the starting point for mobile research. As might be expected search was the most common starting point, but it's lower than desktop showing the importance of branded apps and mobile sites.
The 5 best sources for reviewing mobile marketing statistics in 2017?
This update to this post features some of the latest updates on mobile statistics from 2014 and highlight some of the best sources to make the business case for investment in mobile marketing in your presentations and business cases to colleagues or clients.
- 1. Google Consumer Barometer. A regular survey for different countries starting in 2011, this enabled you to prepare your own reports. Google's Consumer barometer enables you to create similar reports.
- 2. ITU. The International Telecoms Union data reports mobile usage including mobile broadband subscriptions to show growth in use of mobile. This reported at country, continent and overall levels, so is the best overall source for mobile penetration worldwide. Much of the information is free - see their free mobile statistics section.
- 3. Flurry Mobile Analytics. This is a great source for showing the overall level of app usage across the four major mobile app platforms by country and drilling down into the popularity of individual apps for different sectors like retail, banking and travel. For example, the latest mobile app growth figures from Flurry show growth of category use by more than 50% in many categories.
- 4. Comscore Digital Future Series. Comscore is one of the key worldwide sources useful for marketers to help us find out about the changes in use of mobile media by consumers. You will see we have referenced this a lot. This graph shows the pattern across Europe - follow the link above for US and other country breakdowns.
- 5. Ofcom Internet usage report. Ofcom’s Tenth International Communications Market Report was published in December 2016, this examines take-up, availability, price and use of broadband, landlines, mobiles, TV, radio and post across 17 major countries.
We hope this compilation of statistics about mobile usage and effectiveness continues to be useful - please share if it is and we'll continue to update it in 2017.
If you want a single source of the latest stats across the whole of digital marketing, for Expert members, we compile a regularly updated set of usage statistics to use in presentations - it's updated each quarter so all the latest stats are categorised in a single place for including in presentations. Our Expert member resources also include templates and guides to help create digital strategy and plans.
Our "one-stop" download includes the latest stats to include in presentations to make the case for digital investment.
Download our Online marketing statistics compilation.
Contributer : Smart Insights


No comments:
Post a Comment