


The 7 Best Instagram Analytics Tools (And Metrics You Need to Track)
Tracking the right Instagram analytics is essential for growing your audience and becoming more influential on the platform.
Instagram Insights, the app’s built-in analytics tool, is basic and easy to use, but as your following grows you’ll want something more robust to track your metrics.
Fortunately, there are plenty of external Instagram analytics tools that will give you a deeper look into your data. I’ve included a shopping list of these at the end of the guide!
Bonus: Download a free checklist that reveals the exact steps an adventure photographer used to grow from 0 to 110,000 followers on Instagram with no budget and no expensive gear.
Important Instagram metrics to track
There are two broad metrics to consider on Instagram: Individual post metrics and account metrics.
Individual metrics reflect the performance of each photo or video post. Account metrics combine all the stats from your individual posts to track your Instagram success over time.
Individual post metrics
- Impressions: How many people saw your post
- Instagram reach percentage: Impressions divided by number of followers
- Engagements: How many times a post is liked, commented on, shared, or saved
Impressions
Impressions data reveals how effectively you’re promoting your content. Using well-chosen and relevant hashtags will ensure your photos and videos reach a wide audience, improving your impressions score.
Instagram reach percentage
Optimizing hashtags is just one way to get more eyes on your Instagram feed. To increase your reach percentage, you’ll need to factor in other elements too, like picking the best time to post.
Instagram feeds don’t show content in chronological order anymore, but you can still take advantage of optimal posting times to generate engagement as soon as your post goes live. Instagram Insights will show you when your followers are most active so you can schedule your Instagram posts most strategically.
Engagements
Generally, engagement rate is the most important metric to keep in mind, for individual posts and your account as a whole.
Likes, comments, shares, and saves; these interactions help you measure engagement. Take note of which posts are getting the most interactions, and what types of interactions they’re getting.
In the early stages of growing your Instagram account, comments are especially valuable engagements. Whenever someone comments or tags a friend, you’re getting qualitative insights about your content. You can start building relationships with your followers by liking and replying to them, fostering further engagement.

Engagement rate
Post interactions ÷ total follower count ✕ 100
Calculate engagement rate by combining a post’s total number of interactions, dividing that figure by your total follower count, then multiplying by 100. Each type of interaction only counts once. A person commenting multiple times on the same post won’t have any extra effect on a post’s overall engagement rating. But one like and one comment from the same person each count separately.
Let’s say you have 2,000 followers, and your latest post got 300 likes, 50 saves, 10 comments, and 18 shares—378 engagements total.
378 / 2000 * 100 = 18.9 percent engagement rate
18.9 percent engagement means you’re killing it. However, the more your following grows, the more difficult it is to maintain double-figure engagement. A general benchmark for good engagement hovers somewhere between three and five percent.
Account metrics
Account metrics combine all your individual post stats so you can track your profile’s effectiveness over time. There are three main metrics to keep in mind starting out:
- Engagement rate: The percentage of your following that interacts with your posts
- Follower growth rate: Percentage of followers gained over time
- Audience metrics: How many total followers you have, your follower demographics (location, age, and gender), and the times your audience is most active
Engagement rate
Account engagement is the average interactions your account gets as a whole. The more followers you earn, the more difficult it becomes to maintain a high engagement rate.
Still, you should always strive to keep engagement as high as possible. As your following grows, you can adapt your benchmarks—it’s definitely not feasible to respond to every single comment when you have 50,000 followers. But you should respond to some of them, so people are inspired to continue engaging with you.
Follower growth rate
Number of followers gained ÷ previous number of followers ✕ 100
This metric shows you how much your following has grown over time. Watch for trends signifying high or low engagement periods—this will show you the best times to schedule your posts.
To calculate follower growth rate, divide the number of followers you’ve gained in a given period by the number you had previously, and multiply that by 100.
Let’s say your Instagram account had 2,000 followers in May, and by June, you’re up to 2,099.
99/2000 = 0.0495 * 100 = 4.95 percent follower growth rate
Audience metrics
Instagram Insights provides basic demographics info under the Audience tab: gender and age distribution, geographical location, and periods of activity.
Familiarize yourself with your audience, their interests, and their browsing habits, so you can post more targeted and engaging content at optimal times.
Instagram Stories metrics
Once you start posting Instagram stories regularly, you’ll want to track their effectiveness. They’re becoming an increasingly important part of the Instagram experience, with more than 400 million daily active users.
Story-specific interactions
Stories have four engagement types:
- Taps Forward: How often your audience taps to the right, skipping the current Story to see the next one you’ve posted
- Taps Backward: How often your audience taps to the left to watch the previous video in your Story sequence
- Exits: How often someone uses the “swipe down” feature on a particular story to exit the Stories feed and return to the main Instagram content feed
- Replies: How often someone used the “swipe up” feature to comment directly to your Story, or navigate to the content you’re linking to in your story
If your Story has lots of taps forward or exits, it was probably a poor experience. Was the audio or video quality subpar? Was your Story just plain boring? Figure out what went wrong, and correct it for next time.
If your Story has a high number of taps backward, it could mean one of two things: 1) the Story was good enough to warrant a re-watch, or 2) your video was unclear, or ended too quickly.
Story replies are basically like comments on your regular posts—an opportunity to learn more about your audience. Read them to get a better sense of who’s watching your Stories, and what they want to see next.
Reach and impressions
Always keep tabs on how many people watch your Stories. Reach and Impressions might sound like the same thing, but there’s a subtle difference:
- Reach counts the number of Instagram accounts that watched your story
- Impressions is the number of individual views, including rewatches
If you feel like your Story engagement is low, check how many people watched your video. If you get a lot of engagement for a Story, but your Reach is low, the takeaway might be to use more popular hashtags next time to tap into a wider audience.
Instagram Ads metrics
To get the most out of Instagram ads, you have to link your account up with a Facebook for Business profile. Besides tracking the usual suspects like reach and impressions, you’ll want to track Instagram advertising’s most important metrics: click-through rate, and conversions.
Click-through rate
This metric measures how compelling your call-to-action is. People seeing your ads on Instagram isn’t enough. They also have to take the next step and tap through to your purchase page.
Analyzing your click-through rate and performing A/B tests will help you find the perfect words that resonate with customers and boost your sales.
Conversions
All your social media advertising efforts are building up to this. Even if you’re posting gorgeous ads with incredible CTAs and generating tons of likes and comments, your landing pages still have to make customers take that final step and purchase.
Not sure where to start with your landers? You’re in luck: here are eight hot tips for building powerful landing pages on Instagram.
Instagram analytics tools
Now that you’re familiar with some of Instagram’s most important metrics, it’s time to look at some tools that will help you make the most of your data.
To help you get started, I’ve provided a quick list of analytics tools and their unique selling points. I’ve tried to pick a range of examples to show what it’s possible to learn about your customers with the right data.
1. Instagram Insights
Instagram’s built-in analytics tracker lets you check in on your profile performance at a glance.
The main advantage of Insights is its simplicity. You can quickly check in on your past week’s progress on mobile while you’re on-the-go.
Insights’ biggest disadvantage is that you can’t easily gain a bigger-picture understanding of your efforts over time. The data is fairly limited, and you can’t export any of it from the app. If you want to do some number crunching in Excel, you’ll have to use a third-party analytics tool to export your data.
2. Hootsuite Analytics
No list of Instagram analytics tools would be complete without Hootsuite Analytics. We’re really proud of what our product offers Instagram users, from competitive analysis tools to graphs and charts that clearly map out your account data so you can identify trends instantly.
Hootsuite Analytics also allows you to look much further back into past post data than Instagram’s native analytics tool, so you can determine KPIs and measure channel growth with greater confidence.
A particularly neat feature that sets Hootsuite Analytics apart is the ability to track inbound Instagram messages by sentiment. Hootsuite Analytics automatically assesses whether comments are positive or negative, so you can easily track audience reactions over time.
For more info on what Hootsuite Analytics can do for your social efforts, check out our video:
3. Iconosquare
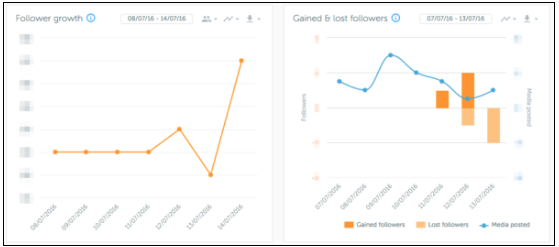
Image via Yoast.
Facebook and Instagram analytics tool Iconosquare has a generous offer for first-time users: a free audit of your Instagram profile. When you sign into the platform, they’ll email you a performance review with tips on how to optimize your content.
Iconosquare lets you easily export your data manually, and you can schedule automated reports to be sent to your inbox. You can even export reports by timezone to see how you’re engaging different audiences around the world.
4. Union Metrics
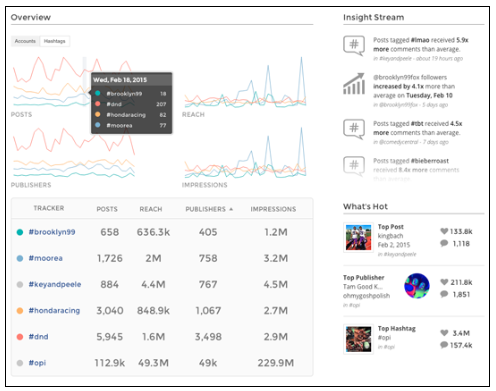
Image via Union Metrics.
Union Metrics takes some of the hassle out of analytics by automatically pulling trends and outliers from your insights stream, so you can immediately identify actionable moments in your post history. You can also monitor your photo tags and mentions so you always know when you’re trending.
Like Iconosquare, Union Metrics offers a free Instagram audit when you sign up.
5. Crowdfire
One strategy to your boost your Instagram audience is to follow as many people as you can. About 30% of accounts will follow you back. Eventually, though, you’ll reach the 7,500 follower cap and this strategy stops working.
Crowdfire helps solve this problem with a unique feature: follower analytics that expose sneaky unfollowers, so you can unfollow them right back! By freeing up space in your Following list, you can continue to grow your audience with mutual relationships.
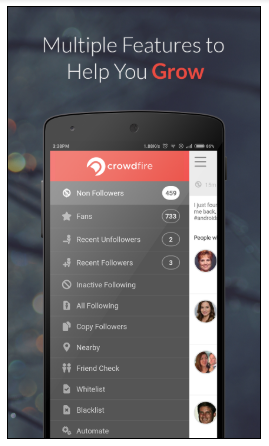
Image via Crowdfire.
Crowdfire also makes it easier to follow your competitors’ audiences, priming you to engage with people who are already interested in similar content.
6. Squarelovin
If you want to leverage user-generated content on your Instagram, check out Squarelovin. Their Insights tool focuses on helping you get the most out of the videos and images your followers tag you in on the platform—while also making sure you’re not running into any copyright issues.
Another feature I love on Squarelovin: tracking the impact of specific Instagram filters. Yes, even something as small as this can impact engagement!
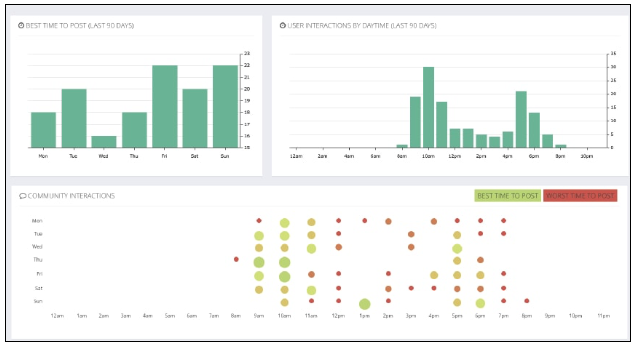
Image via Squarelovin.
7. Plann
This Instagram-focused scheduling and analytics tool will help you focus on curating the most beautiful feed possible. Similar to Squarelovin’s filter tracker, Plann’s analytics will reveal which color schemes your audience likes best. You can even compare your most effective color schemes against your competitors via Plann’s “Sneaky Peek” feature. What a time to be alive!
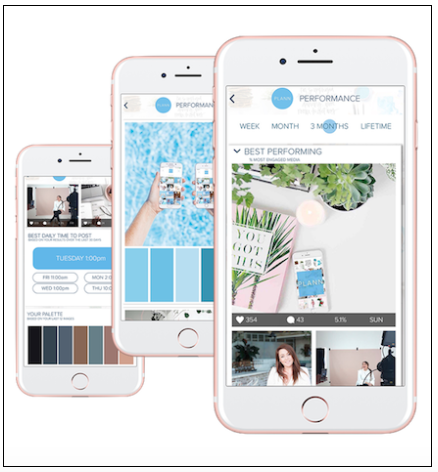
Image via Plann.
As you can see, there are a lot of options for Instagrammers looking to roll up their sleeves and dig into the data behind their photos and videos. Experiment and find the analytics tool that works best for you!
Save time managing your Instagram presence with Hootsuite: Share photos and videos, schedule posts ahead of time, and monitor your efforts using our comprehensive suite of social media analytics tools. Try it free today.
The post The 7 Best Instagram Analytics Tools (And Metrics You Need to Track) appeared first on Hootsuite Social Media Management.
Contributer : Hootsuite Social Media Management https://ift.tt/1r41HhO

 Reviewed by mimisabreena
on
Wednesday, July 18, 2018
Rating:
Reviewed by mimisabreena
on
Wednesday, July 18, 2018
Rating:


No comments:
Post a Comment