


YouTube Analytics: A Simple Guide to Tracking the Right Metrics
Getting to know YouTube analytics is crucial if you want to make the most of your YouTube channel. By quantifying the successes and failures of your videos, you can zero in on opportunities to provide value to your subscribers and keep them engaged.
You can also expand your brand’s reach on the web’s second largest search engine.
In this article, we’ll show you:
- Which metrics you should prioritize in your YouTube channel analytics, and why
- The difference between vanity metrics and actionable data
- How to choose the right insights to inform your channel’s growth strategy
Bonus: Download a free guide that reveals the exact steps one entrepreneur took to gain more than 23,000,000 views on YouTube with no budget and no expensive gear.
How to use YouTube analytics
- Log into your YouTube account.
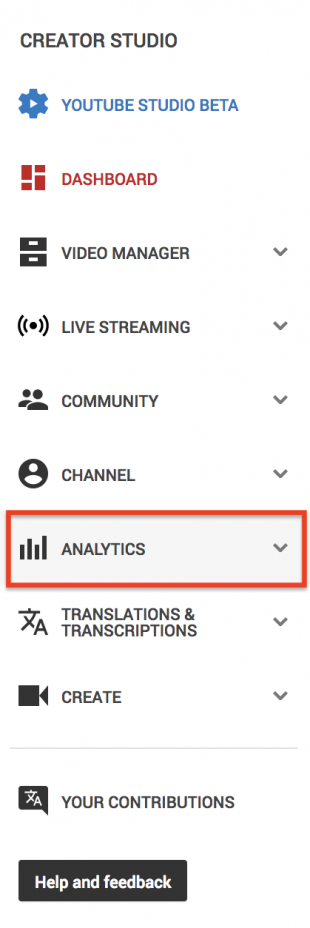
- Click the profile icon in the top right, then Creator Studio, next to the cogwheel icon.
- This will bring you to the Creator Studio dashboard—you should see some basic analytics in the middle of your screen (Watch time, Views, Subscribers, and Estimated revenue—more on these later).
- To the left of this panel, you’ll see a menu. Click Analytics to navigate to the main YouTube analytics dashboard.
General features of the YouTube analytics panel
Each analytics page’s Overview header features drop-down menus on the right. This is where you can narrow down the time period for the data you’re examining.
Default settings show the last 28 days, but you can change them to whatever suits your needs. Depending on the analytics page, you can also filter by continent or country for specific geographical insights.
If you ever want to crunch numbers yourself, you can export datasets as Excel or CSV text files using the Export report button in the top right.
Finally, if you’re ever confused about what an option means in YouTube, look out for the small grey question mark icon. Click it to reveal a helpful tooltip!
Youtube metrics: What to measure to improve video performance
YouTube video analytics features three main sections: Revenue reports, Watch time reports, and Interaction reports.
Let’s check out Watch time reports first. This is where you’ll find some of the most commonly discussed stats, including watch time, views, and retention.
Watch time reports
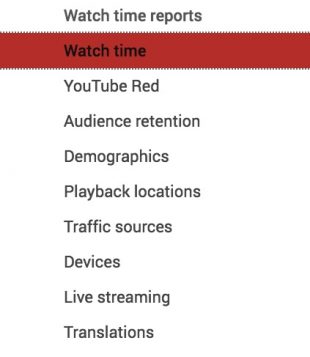
The Watch time report compiles data from your YouTube channel, the individual videos on your channel, and any engagement from YouTube’s mobile apps.
Here’s a quick summary of the most important watch time analytics on YouTube, and the questions they answer:
- Watch time: how long are people watching my videos? How many views do I have?
- Audience retention: how consistently are people watching my videos? When are people interacting with my content? When do they stop watching?
- Demographics: who’s watching my videos? What countries are my views coming from
- Playback locations: where are people actually playing my videos?
- Traffic sources: where are people discovering my videos?
- Devices: what percentage of my views come from desktop, mobile, or elsewhere?
Watch time and Views
Though Views and Watch time are on the same page, these stats are interdependent. A YouTube video earns one view when it’s watched for 30 seconds or longer.
Views are often considered the measure of a video’s success. But, from a marketing standpoint, they’re mostly a vanity metric.
(Vanity metrics are numbers that are easily artificially inflated, so they’re not the most accurate way to measure your channel’s progress.)
Still, if you have a high number of organic views, it means your videos are well-optimized and ranking prominently in YouTube’s search pages—which is great! More importantly, if you divide Watch time by total Views, you get an extremely valuable stat: your Average view duration.
Watch time ÷ views = average view duration
Average view duration is an extremely important statistic. It can be measured on a per-video basis, or to measure the average amount of time people spend watching videos on your channel as a whole.
If your videos have a high Average view duration, YouTube’s algorithm will see that you’re keeping eyes glued to their platform. It’ll bump your video higher in the search pages and increase the likelihood that your content appears in Suggested and Recommended video lists. The more videos you have with high retention rates, the better your channel will rank.
Audience retention
The Audience retention report tracks viewer engagement over time. Here, you’ll find your average view duration stats, a list of your best-performing videos, and insights into how your videos stack up against others on YouTube.
Retention is calculated based on percentage watched: if your video is one minute long and people watch 30 seconds, the retention rate is 50 percent.
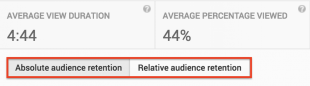
YouTube tracks two types of audience retention: Absolute audience retention and Relative audience retention. To switch between them, click on a video in the list below the Audience retention graph, then scroll back up to the graph. You’ll see the filter below the main stats.
Absolute audience retention
Absolute audience retention shows exactly which moments in your videos are most-watched, and where people tend to drop off.
If you have a high-performing video, look at the Absolute audience retention graph to determine the highlights. Pinpointing engagement trends gives you a better idea of what your audience wants to see, guiding your content creation efforts.
Similarly, if you have a poor-performing video, the Absolute audience retention graph will show you when people tend to stop watching, so you know how to adjust.
YouTube recommends paying particular attention to the first 15 seconds of your videos—introductions have the biggest drop-off rate. If you’re noticing a lack of early engagement, you could:
- Change your thumbnail / video description to more accurately reflect your content
- Remove or shorten a long introduction
- Grab attention by addressing your video topic right away
Relative audience retention
Here’s where you compare your video’s retention rate to all other YouTube videos of similar length.
Because this comparison is only based on duration and doesn’t factor in content, it’s a less useful statistic than Absolute audience retention. It does, however, give a general point of comparison between your content and other videos on YouTube.
Demographics
To find out about the people watching your videos—specifically, their age, gender, and geographical location—check demographics. Getting to know your audience can help you make more informed, targeted marketing decisions. Or it can help you tap into markets you hadn’t considered previously.
Let’s say you’re a UK-based YouTuber who makes videos about building custom computer rigs. You look at analytics, expecting to find a core demographic of of 18 to 24 year old men, but discover your audience is actually female-identified people in the US aged 65 and older.
Armed with this knowledge, you could adjust the tone of your videos to win back your expected demographic, pivot to your newly-discovered audience, or look for a way to please everyone.
Appealing to demographics is important for winning subscribers. They’ll watch twice as much of your video content as people who are just passing through.
Playback locations
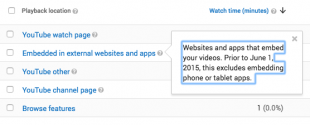
Playback locations shows you where your content is being watched within the YouTube platform, or elsewhere online.
If you want to check traffic from outside YouTube’s pages, scroll down to the list below the graph and click Embedded in external websites and apps. This will bring up a list of all the places your videos have been watched within the selected date range.
Finding out where your videos are being played allows you to optimize your ad spend on those locations, giving you the most reach for your money. You also get insight into your audience’s browsing and watching habits, which may even open doors for new marketing outreach partnerships.
Traffic sources
Here’s where you’ll find out how people are finding your videos.
Each item in the list below the graph can be clicked on to reveal specific information within that category.
Did someone find you by using a specific search term? Are you getting a traffic boost after featuring in a prominent YouTuber’s playlist? These are the questions these metrics can help you answer.
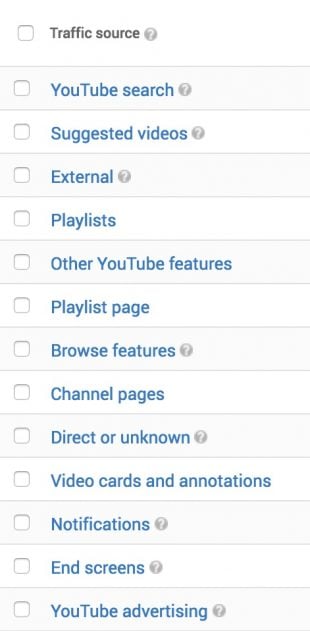
Examining traffic sources data gives you a more detailed sense of your channel’s reach, whether you’re looking at stats related to paid traffic (e.g., YouTube ads), or organic traffic, (e.g., YouTube’s suggested videos feature).
Bonus: Download a free guide that reveals the exact steps one entrepreneur took to gain more than 23,000,000 views on YouTube with no budget and no expensive gear.
Get the free guide right now!Devices
Devices reveals what percentage of your users watch your content on desktop, mobile, tablet, smart TV, or games console.
Devices affect the types of content people watch on YouTube, as well as how they interact online in general.
Mobile users tend to watch on-the-go, so they gravitate towards bite-sized videos. Desktop users are more likely to actually purchase things online. So if conversions are your goal, you might want to cater to that market instead.
Ultimately, it’s good to find a balance, as people watch YouTube on every device. Smart TV viewers, for example, are YouTube’s fastest-growing market. Their numbers double year-over-year.
Interaction reports
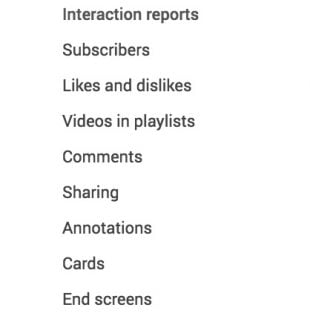
The most important Interaction metrics include Subscribers, Likes and dislikes, Comments, and Sharing—basically all the ways viewers can tell you directly how they feel about your videos. Looking at this data will show you the best opportunities to reach out and cultivate relationships with your subscribers.
Subscribers
The Subscribers page shows general trends around your audience numbers. There are three main data sets:
- Subscribers: how many subscribers you gained and retained in the selected time period
- Subscribers gained: total number of times people subscribed in that time period (even if they unsubscribed again shortly after)
- Subscribers lost: total subscriber drop-off for that period
If your subscriber count changes noticeably, check out the Source option beneath the page’s graph. It’ll pull up a list of your videos, ranking them according to how much they’ve influenced your subscriber count, either positively or negatively. You can also organize this data by subscribers gained or lost.
Like views, subscriber count is a bit of a vanity metric, but the more subscribers you gain, the more authoritative your channel will appear on YouTube—leading to even more subscribers, views, data, and insights!
Note: Subscribers data it isn’t displayed in real-time. YouTube strictly monitors subscriber counts to make sure nobody is trying to artificially inflate their following. This means that if you post a video that ignites unexpected controversy on your channel, the Subscriber data might not show any impact until 48 hours later.
Likes and dislikes
Watch your likes, dislikes, and comments closely to make sure you’re not losing touch with your audience.
Likes and dislikes allow viewers to express themselves with one click. Similar to Views, Likes are a bit of a vanity metric, but the more you have, the better your YouTube SEO ranking will be.
You probably don’t want dislikes on your channel, but if they’re balanced by enough likes, it might not be so bad. If your videos deal with polarizing topics, for example, likes and dislikes simply represent people falling on different sides of the fence.
To get the clearest sense of the motivations behind likes and dislikes on your videos, you’ll have to drill down into the comments.
Comments
Comments tracks how many comments you have on each video, but doesn’t show the comments themselves. If a video gains a lot of engagement in the form of likes and views, you can read the comments to better understand what’s motivating these interactions.
You should constantly monitor comments on your channel. Replying to comments you think are valuable—positive or negative—shows your audience that you’re listening. It’s a good way to foster further engagement and grow your community.
Unfortunately, comments sections can also be toxic, particularly if they’re not well-moderated. Remember to flag instances of abuse or spam to YouTube to keep your channel a safe environment for subscribers.
Sharing
Shares are the last major metric of user engagement. Shares are definitely more important than likes, as they show someone cared enough about your video to encourage others to watch it.
Click the Sharing service filter to see data on where your videos are being shared. You can also filter by geographical location, device, or date.
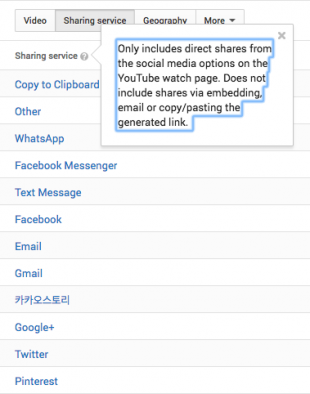
As you can see in this screenshot, YouTube only tracks shares generated by share button clicks. These types of shares count the most for YouTube SEO. To grow your channel most effectively, do as the famous YouTubers do: call on your viewers to like, share, and subscribe at the end of your videos.
Revenue reports
In January 2018, YouTube tightened the rules around channel monetization: to be eligible for ads, YouTube channels must have accrued 4,000 hours of watch time and have at least 1000 subscribers, in addition to adhering to the platform’s rules and regulations.
The Revenue reports feature shows how much money you’re making on YouTube within a given time period, and where your revenue streams originate, including:
- Ads other companies are paying to display on your videos
- Your own paid ads on YouTube
- Income streams from elsewhere on the platform (like YouTube Super Chat)
To keep things simple, I’m just going to give a brief overview of the Revenue report feature itself. If you’re at the point where you’re ready to start making money by advertising on YouTube, I’d recommend looking at the guide I wrote back in March.
Revenue
The two main stats to track under Revenue are:
- Estimated revenue: projected total income from all Google-sold ads
- Estimated ad revenue: projected income from AdSense and DoubleClick ads only
Like other YouTube video analytics, you can filter these by date and geographical location.
Scrolling below the revenue graph will bring you to your list of revenue-generating videos. By default, you’ll begin with the most profitable video within the time period.
Use the Revenue report feature to identify earning patterns. If you’re making more money on certain days of the week, consider modifying your content release schedule to take advantage of these trends.
It’s also good to zoom out and see if there are wider patterns based on time of year.
Let’s say your company sells winter sports gear, and you advertise on YouTube. You might identify a new spike in revenue immediately after ski season, when people take advantage of post-season deals.
To get a birds-eye view of your entire revenue history and start taking advantage of longer-term trends, select “lifetime” in the drop-down menu to the right above the graph.
How to improve your YouTube search rankings
Leveraging your takeaways from YouTube analytics is a guaranteed way to improve your YouTube SEO. As with any sort of SEO, the single best practice is to produce high quality, valuable content that people engage with and share with their friends.
Here are a few final tips to boost your channel’s SEO so your videos rank highly on YouTube’s Search and Suggested videos pages.
Include keywords in your video description
Find relevant keywords using Google’s Keyword Planner and don’t forget to perform some competitive analysis, too. Scope out what other YouTubers in your niche are including in their video descriptions, and include what makes sense.
YouTube also features “tags,” pieces of metadata that help you steer how your videos appear in organic search. You’re allowed to include up to 500 words worth of tags, which should be in line with your video topic.
Follow the rules
Building on the previous point, when you’re writing your video descriptions, make sure they adhere to YouTube’s guidelines on metadata.
YouTube also has a range of other policies on the content you’re allowed to include in your videos. These are mostly common-sense rules, and shouldn’t be too difficult to follow.
Upload videos regularly
It’s well-known that YouTube is becoming more popular than regular TV, particularly among younger people, but the desire for content on a predictable schedule hasn’t changed. If you can cultivate an audience that’s counting down the minutes until your next release, it’s a sure sign that you’re making it big on the platform.
Grow your YouTube audience faster with Hootsuite. It’s simple to manage and schedule YouTube videos as well as quickly publish your videos to Facebook, Instagram, and Twitter—all from one dashboard. Try it free today.
The post YouTube Analytics: A Simple Guide to Tracking the Right Metrics appeared first on Hootsuite Social Media Management.
Contributer : Hootsuite Social Media Management https://ift.tt/2tMBkQz

 Reviewed by mimisabreena
on
Sunday, July 01, 2018
Rating:
Reviewed by mimisabreena
on
Sunday, July 01, 2018
Rating:


No comments:
Post a Comment