


130+ Social Media Statistics that Matter to Marketers in 2019
Whether you’ve been using social media for years or you’re just getting started, it’s important to base your strategy on hard data. That is, social media statistics.
Knowing the facts helps you understand which social networks are a fit for your business, so you can make the most of your marketing budget.
To make sure you’re up-to-date on the latest developments in the social sphere, we’ve compiled the most important social media stats from the industry’s top surveys, studies, and reports.
Let’s dive in.
Table of contents
General social media statistics
Social media advertising statistics
Instagram statistics
Facebook statistics
Twitter statistics
YouTube statistics
Pinterest statistics
LinkedIn statistics
Snapchat statistics
Bonus: Get the step-by-step social media strategy guide with pro tips on how to grow your social media presence.
General social media statistics
Social media use is growing
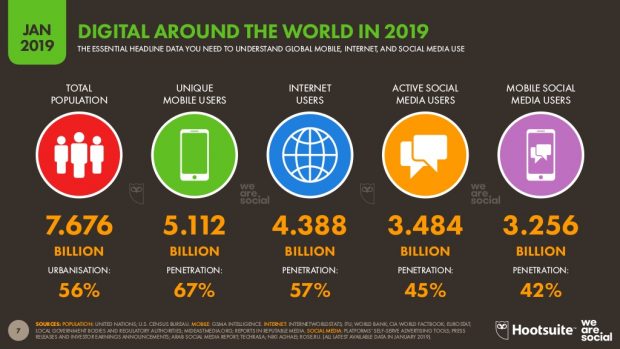
- 3.48 billion people now use social media. That’s an increase of 9% from last year. Put another way: 45% of the total world population are using social networks.
- 366 million new people started using social media in the past year. That’s more than a million new people joining social media every single day.
Mobile social media access is on the rise
- 5.11 billion people now have mobile phones. That’s up 2% from last year.
- Of those, 3.26 billion use their mobile devices to access social media, up 10% from last year.
Social media is integrated into our daily lives
- Digital consumers spend nearly 2.5 hours on social networks and social messaging every day.
- 69% of U.S. adults use at least one social media site.
- The average American Internet user has 7.1 social media accounts.
- 88% of American 18- to 29-year-olds use social media.
- 51% of 18- to 24-year-olds say social media would be hard to give up.
Brands have embraced social marketing
- 90% of brands use social media to increase brand awareness.
- But 58% of brands say measuring the effectiveness of social is a challenge, and only 34% measure social ROI.
- 28% of marketers have either already implemented social commerce or plan to do so in the next year.
- 77% of brands expect their use of social media to increase.
- Most businesses maintain between four and 10 social profiles.
Consumers use social to interact with brands
- More than 40% of digital consumers use social networks to research new brands or products.
Stories are taking social by storm
- Stories are set to outpace feeds in 2019.
- Nearly a billion people use stories across WhatsApp, Instagram, Facebook, and Snapchat.
- Stories are growing 15 times faster than feed-based sharing.
- 80% of major brands now use stories on at least one social network.
Social media advertising statistics
Businesses are on board with paid social
- 53% of businesses use social advertising.
- Social media ad spend in 2019 is expected to be nearly $93 billion.
- 7 million businesses use paid advertising on Facebook.
- 2 million businesses use paid advertising on Instagram.
- The number of small-to-medium-size businesses using YouTube ads has doubled in the past 2 year.
- The number of small businesses using Pinterest ads increased 50% from 2017 to 2018.
- 2 million advertisers use stories across Facebook, Instagram, and Facebook Messenger.
Social ad spend is increasing
- Global social media advertising spending increased 32% in 2018.
- That spending is predicted to grow an additional 73% in the next five years.
- Facebook’s advertising revenue was more than $55 billion in 2018. For Q4 2018, 93% of that ad revenue came from mobile ads.
- Instagram brought in an estimated $6.84 billion in mobile advertising in 2018, up from $3.64 billion in 2017.
- Twitter’s advertising revenue was 2.6 billion in 2018, an increase of 25% over 2017.
- In 2018, YouTube generated $3.6 billion in video ad revenues in the U.S. alone, up 17.1% from 2017.
- Pinterest is expected to bring in $771.4 million in U.S. ad revenues in 2019, an increase of 39.4% over 2018.
- Snapchat made an estimated $660 million in U.S. ad revenues in 2018, up 18.7% from 2017.
Social ads deliver business results
- A typical American Facebook user clicks on 8 Facebook ads per month.
- Half of Generation Z and 42% or Millenials says social media is the most relevant ad channel.
- Snapchat’s collection ads had double the return on ad spend of other Snap ad formats in Q4 2018.
- Twitter ad recall is 60% higher for brands with consistent logo placement.
- Promoted Tweets with videos save 50% on cost per engagement.
Make your campaigns go further by including video ???? pic.twitter.com/udqLfmiPgN
— Twitter Business (@TwitterBusiness) January 9, 2019
Learn more in our full post on social media advertising stats.
Instagram statistics
Users
- There are more than 1 billion monthly active users of Instagram worldwide.
- Roughly 60% of Instagram users access the platform every day.
- 500 million people use Instagram stories daily.
- 104.7 million people in the United States use Instagram, an increase of 13.1% from 2017.

Demographics
- Roughly half of U.S. users are between the ages of 18 and 34.
- 39% of women and 30% of men use Instagram in the U.S.
- Instagram became the top platform for teenagers in Fall 2018, when it surpassed Snapchat for the first time: 72% of U.S. teens now use Instagram.
Network activity
- 60% of users visit Instagram daily, and 38% visit multiple times per day.
- Instagram was the second-most downloaded iOS app in 2018.
- #Fortnite was the fastest growing hashtag in 2018.
Brands on Instagram
- Instagram has more than 25 million business profiles.
- 74% of businesses worldwide use Instagram.
- 80% of Instagram users follow at least one business on Instagram, and more than 200 million people visit at least one business profile every day.
- A third of the most viewed Instagram stories are from businesses.
- 60% of Instagram users claim they’ve discovered at least one new product on the platform.
Learn more in our full posts on Instagram statistics and Instagram demographics.
Facebook statistics
Users
- Facebook has 2.32 billion monthly active users as of December 2018, an increase of 9% from the previous year. It remains the top-ranked social platform.
- 150 million people use Facebook Stories daily.
- In the United States, 169.5 million people use Facebook, an increase of 0.9% from 2017.

Demographics
- On Facebook, the number of users aged 65 and up has doubled since 2012. 41% of U.S seniors now use the social network.
- Use among U.S. teenagers is shrinking, from a high of 71% in 2014-15 to 51% in spring 2018.
- 68% of U.S. adults use Facebook, most of them daily.
- 74% of U.S. women use Facebook, compared to 62% of U.S. men.
- 76.9% of mobile Facebook users access the network on an Android device, compared to 14.1% using an Apple device.
Network reach
- Facebook is the second-most popular site in the world, behind only Google, and boasts an average time per visit of 10:57.
- The average reach of a post is 8% of total page likes.
- The average Facebook engagement rate for all types of page posts is 3.75%

Network activity
- Roughly 74% of Facebook users access the platform daily, and 51% visit multiple times per day.
- Nearly half of U.S. adults (43%) get their news from Facebook.
- 26% of Facebook users have watched a live stream video in the past month.
- The average Facebook user has liked 9 posts in the last 30 days, and shared one.
- Facebook Live videos get six times more interactions than regular video content.
Brands on Facebook
- 95% of businesses worldwide use Facebook.
- 1.6 billion people are connected to small businesses on Facebook.
- People and businesses exchange more than 10 billion messages per month.
- After messaging a brand on Facebook, 66% of people feel more confident about the brand, and 55% feel more personally connected to the brand.
Learn more in our full posts on Facebook statistics and Facebook demographics.
Twitter statistics
Users
- Twitter has 321 million monthly active users. This is a decline of 3% from 330 million users in 2017.
- However, the number of users in the United States grew slightly in 2018, to 55.2 million.

Demographics
- 40% of Americans aged 18 to 29 use Twitter. That percentage drops with each subsequent age group.
- As on many other platforms, individuals with a college degree are more likely to use Twitter: 32% of degree-holders use the platform, compared to 25% with some college education, and 18% with a high school education or less.
Network activity
- Roughly 46% of Twitter users visit the platform daily, and 26% visit multiple times per day.
- Users post about 500 million tweets per day.
- 71% of Twitter users get at least some of their news from the platform.
- 125 million hashtags were shared every day in 2018.
- Twitter has 1.2 billion total video views per day.
- 93% of of those video views are on mobile devices.
- Tweets with video get 10 times more engagement than those without. They are also 6 times more likely to be retweeted.
- Tweets with GIFs get 55% more engagement than those without. However, only 2% of Tweets contain GIFs.
- The most used emoji is .
What better way to celebrate #WorldEmojiDay than with some ????✨data✨?????
These are the most used emojis on Twitter the past year:
➖????
➖????
➖????
➖❤️
➖????
➖????
➖????
➖????
➖????
➖????— Twitter Data (@TwitterData) July 17, 2018
Brands on Twitter
- 84% of businesses use Twitter.
- 85% of small-and-medium businesses with Twitter accounts say Twitter is important for customer service.
Learn more in our full posts on Twitter statistics and Twitter demographics.
YouTube statistics
Users
- More than 1.9 billion logged-in users visit YouTube every month.
Demographics
- 94% of U.S. 18- to 24-year olds use YouTube, and 73% of all U.S. adults.
- YouTube is the top social site for U.S. teens: 85% of them use the service.
- 40% of U.S. seniors use YouTube. Only Facebook outranks YouTube in this age category.
Network reach
- YouTube is the second-ranked social platform worldwide.
- YouTube was the most-downloaded iOS app in 2018.
Network activity
- Roughly 45% of YouTube users access the platform daily, and 29% visit multiple times per day.
- YouTube users watch more than a billion hours of video per day.
- 70% of millenial YouTube users have used YouTube to learn how to do something new.
- 21% of American adults get at least some of their news from YouTube.
- More than 70% of YouTube watchtime comes from from mobile devices.
- People watched more than 50,000 years of product review videos over the last two years.
Brands on YouTube
- 61% of businesses worldwide use YouTube.
Learn more in our full post on YouTube statistics.
Pinterest statistics
Users
- Pinterest has more than 250 million monthly active users.
- 77.4 million of those users are in the United States. That’s an increase of 7% from 2017.

Demographics
- Pinterest remains more popular with women, as 41% of women use the platform, compared to just 16% of men.
- Pinterest is used by 34% of Americans aged 18-49.
Network activity
- There are more than 175 billion pins on Pinterest, an increase of 75% since early 2017.
- 80% of Pinterest users access the network on mobile devices.
Brands on Pinterest
- 1.5 million businesses worldwide use Pinterest.
- 83% of weekly Pinterest users have made a purchase based on brand Pins.
- 77% of Pinners have discovered a new brand or product on the network.
- 84% of Pinners use Pinterest when trying to decide what to buy.
- 66% of Pinterest users use the network to find last-minute holiday gift ideas.
Learn more in our full posts on Pinterest statistics and Pinterest demographics.
LinkedIn statistics
Users
- LinkedIn has more than 610 million users.
- LinkedIn gets two new members every second.
Demographics
- LinkedIn is especially popular among high-income earners and college graduates. About 50% of degree holders use LinkedIn, compared with just 9% of those with a high school diploma or less.
- LinkedIn users include 10 million C-level executives, 3 million MBA graduates, and 6 million IT decision-makers.
Network activity
- 57% of LinkedIn traffic comes from a mobile device.
- LInkedIn feeds see more than 9 billion content impressions per week.
Brands on LinkedIn
- 62% of businesses use LinkedIn, but 86% of B2B companies use the network.
- There are more than 30 million companies on LinkedIn, with more than 20 million open jobs.
- The top priority for businesses using LinkedIn in 2019 is to drive more leads (63%).
- 90% of LinkedIn users say they are open to the right job opportunity.
Learn more in our full posts on LinkedIn statistics and LinkedIn demographics.
Snapchat statistics
Users
- Snapchat has 186 million daily active users.
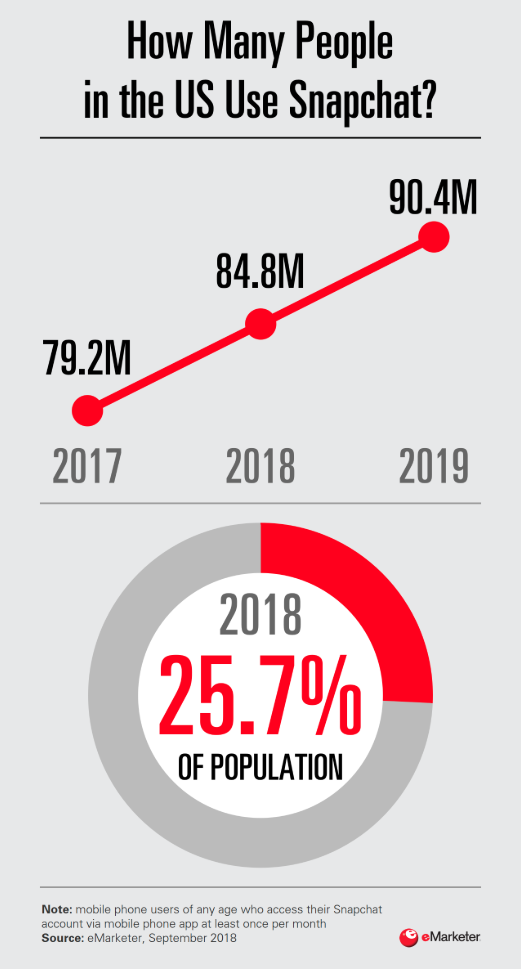
- In the U.S., there were 84.8 million monthly active users in 2018. eMarketer predicts this will increase to 90.4 million in 2019.
Demographics
- 78% of Americans between the ages of 18 and 24 use Snapchat.
- Use drops with age: 54% of those between the ages of 25 and 29 use the app, and 25% of those between 30 and 49.
Network activity
- Roughly 63% of Snapchat users access the platform daily, and 41% do so multiple times per day.
- In fact, the average daily active Snapchatter opens the app more than 20 times a day and spends an average of 30 minutes in the app each day.
- Users post more than 3 billion Snaps every day.
- Snapchat was the third-most-downloaded iOS app in 2018.
Brands on Snapchat
- 8% of businesses worldwide use Snapchat.
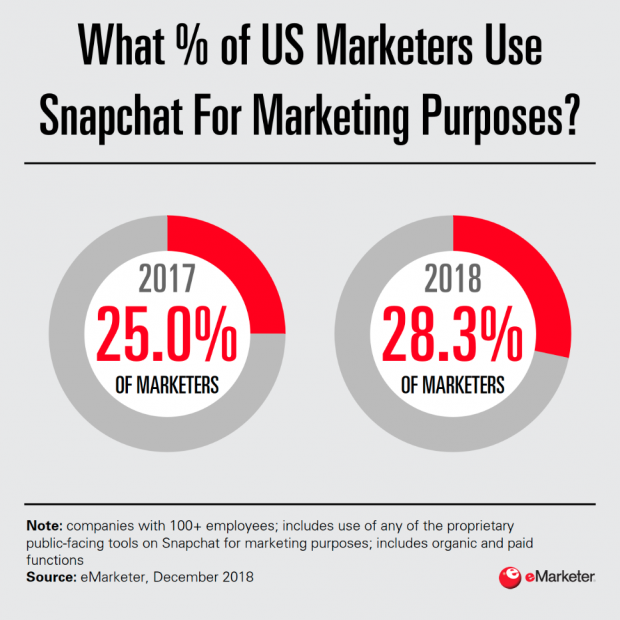
- In the U.S., 28.3% of marketers use Snapchat, up from 25% in 2017.
Learn more in our full posts on Snapchat statistics and Snapchat demographics.
If you’d like to dive deeper into the above social media statistics, the sources, again, are:
- The 2019 Global Digital Yearbook from We Are Social and Hootsuite
- The Hootsuite Social Media Trends 2019 report based on 3,000 customer surveys, interviews with industry analysts, and extensive market research
- The Hootsuite Social Media Barometer 2018, based on a survey of 9,000 B2B and B2C organizations
- Self-reported data and financial reports from the major social networks
- The Pew Research Centre
- The GlobalWebIndex Flagship Report 2018
Put these stats to good use by using Hootsuite to help you schedule and manage your latest social media strategies. Try it for free today!
The post 130+ Social Media Statistics that Matter to Marketers in 2019 appeared first on Hootsuite Social Media Management.
Contributer : Hootsuite Social Media Management https://ift.tt/1SrOy8l

 Reviewed by mimisabreena
on
Thursday, March 07, 2019
Rating:
Reviewed by mimisabreena
on
Thursday, March 07, 2019
Rating:


No comments:
Post a Comment