


How to Use Twitter Analytics: The Complete Guide for Marketers
Twitter’s 139 million daily active users interact with brands on the network in important ways, from retweeting your content to a broader audience to making purchases that directly impact your bottom line. If you’re not using Twitter analytics, you’re missing out on key Twitter insights that could help you refine your strategy and maximize ROI.
In this complete guide, you’ll find out why you should be using Twitter analytics, which Twitter metrics to track, and what tools to track them with.
Bonus: Download the free strategy guide that reveals how Hootsuite grew our Twitter following to over 8 million users and learn how you can put the tactics to work for your business.
Benefits of using Twitter analytics
Learn about your audience
Knowing your audience is one of the most important guiding principles for every social media marketer.
After all, how can you craft a targeted message if you don’t know who’s listening?
Understanding your audience’s age, gender, household income, language, and geography, helps you craft content that will be relevant to them.
With any platform, it’s good to start by familiarizing yourself with overall audience demographics.
This can be especially helpful if you’re a new brand without much of an audience to analyze yet. But it’s just a start. Your specific audience might look very different from Twitter’s general audience.
For instance, the overall Twitter audience is 69% male and 31% female.
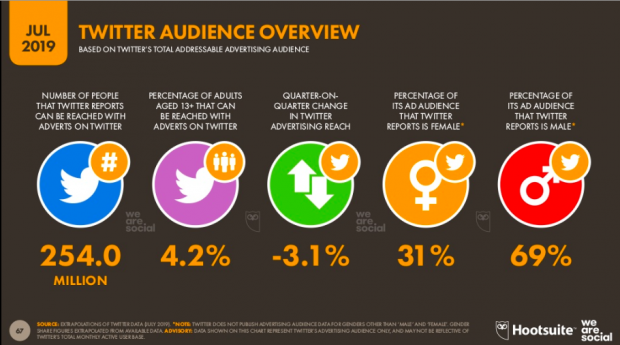
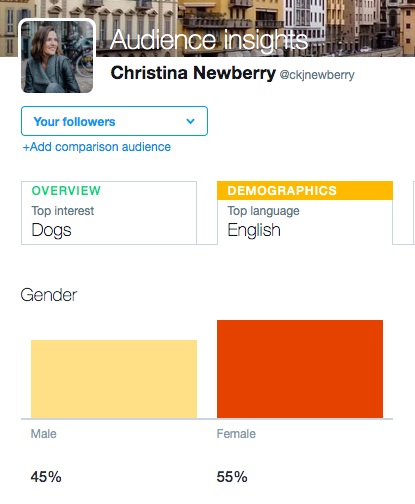
But, my Twitter audience is 55% female. If I crafted my Twitter strategy based on overall Twitter demographics, I’d be talking to the wrong people.
You need to understand the demographics of the people who have specifically chosen to follow you on this particular network. Twitter analytics can help you conduct this critical audience research as you grow your brand and your following.
In addition to core demographic categories, Twitter analytics gives you information about your followers’ interests, what devices they use, their behaviour, and the keywords they search. You’ll see from the screencap above that my followers’ top interest is dogs.
As a writer, it might be a bit strange for me to start loading my feed up with dogs. But if I were selling products like clothing or home accessories, or even services like travel or life insurance, these Twitter insights might suggest that I should test images that include dogs in my Tweets and Twitter ads.
Find out what content resonates
Twitter data shows that Tweets with video get 10 times more engagements than Tweets without.
Tweets with video attract 10X more engagements than Tweets without video. Visually, that's:
With video Without video
???????????????????? ????
????????????
???????? https://t.co/WZs78nfK6b— Twitter Business (@TwitterBusiness) December 13, 2018
But you can’t just assume this applies to your specific audience. Maybe your audience prefers Tweets with photos or infographics. Or, like the Hootsuite Twitter audience, maybe they really love GIFs.
As you build your Twitter marketing strategy, you might be held back by making assumptions about what your brand “should be.” But maybe your Twitter followers (or potential followers) are looking for something else.
For example, in April, the Monterey Bay Aquarium decided to break from its serious, credible tone by tweeting a series of memes:
5 Jobs Sunfish Edition
1. Boxfish-Class Heavyweight Champion
2. Professor of Biomechanics
3. Freestyle Swimmer
4. Design-By-Committee Chairman
5. Baby Wheel Impersonator pic.twitter.com/GJg6zLtiwj— Monterey Bay Aquarium (@MontereyAq) April 24, 2019
Some people at the aquarium thought this was not a great idea. “A lot of people at the aquarium view being silly or funny as somehow undermining our scientific credibility,” said Patrick Webster, the aquarium’s social media content creator.
But the memes got engagement numbers well above the aquarium’s norm. You know what you like. Only Twitter analytics can show you what your audience likes.
By keeping an eye on Twitter engagement metrics, you can learn precisely what connects with your followers, so you can develop a Twitter strategy that speaks directly to them.
Post at optimal times
As we point out in our post on the best times to post on each social network, “The best time to post on social media is whenever your audience is most likely to see and engage with your content.”
This is especially true for Twitter, where it’s easy for users to choose to view tweets chronologically rather than in an algorithmic feed. That’s one reason why the lifespan of a tweet averages only about 18 minutes.
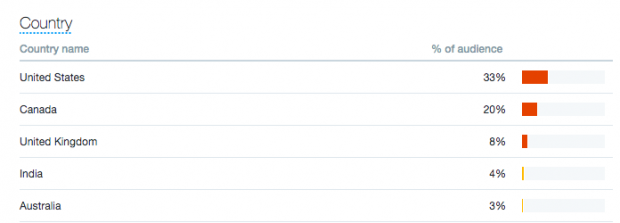
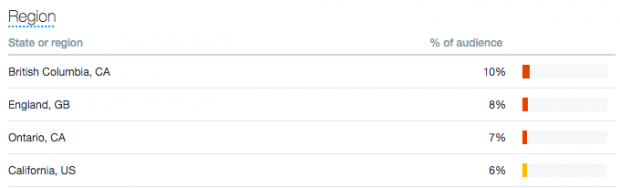
Twitter analytics tools give you loads of great data to help you figure out when your audience is most likely to be online. The most important thing is to find out where most of your followers live. You can get a breakdown by country, and by state or region.
You can also look at what devices your audience uses. This will tell you whether to try to reach people while they’re commuting, or if you should stick to business hours. If you discover, for example, that 92% of your audience accesses Twitter on a computer, you can bet they’re likely to be online while they’re at work.

Use this information as a starting point and do some simple testing to see what times get the most effective engagement.
See if your ads are working
If you’re putting your money where your tweets are, you want to know what kind of return on investment you’re getting.
Twitter analytics can show you how your paid ads compare to your organic tweets, so you can see how much your ad dollars are expanding your reach overall.
You can also use Twitter analytics tools to compare the effectiveness of different promoted tweets. For example, Twitter data shows that overall, shorter video ads are most memorable.
#WednesdayWisdom pic.twitter.com/fqM7BL0nSe
— Twitter Business (@TwitterBusiness) August 7, 2019
But do short videos resonate best with your audience? And do they lead to real business results like clicks and conversions? Twitter analytics can help you find out.
Replicate success
Twitter analytics help you understand which tweets work best, and which tweets are a bit of a flop. Analyze your best-performing tweets to look for patterns, so you can start to understand what works best for your particular audience.
You can use what you learn to help build your social media style guide.
Meanwhile, use your worst-performing tweets as examples to learn from by trying to pinpoint what went wrong.
11 of the most important Twitter metrics to track
There are three main categories of Twitter metrics:
- Account metrics apply to your overall Twitter profile and your follower base
- Individual tweet metrics track the engagement numbers for specific tweets
- Ad metrics track how well promoted tweets perform, from vanity metrics right through to conversions and ROI
Top account metrics
You’ll find these metrics on the Home tab of your Twitter analytics dashboard. They’re reported monthly.
1. Top tweet
What it measures: The tweet that earned the most impressions for a given month.
Why it matters: Since this tweet reached your largest audience, it’s a good example of what you’re doing right. That could be tweeting at the right time of day, using the right hashtags, including great targeted content that encouraged reshares, or all of the above. You may want to consider Quick Promoting this tweet to extend its reach even further—or at least noting its success so you can replicate it in the future.
2. New followers
What it measures: The number of new account followers in a particular month.
Why it matters: A follow is a longer-term engagement than a like or retweet, so if you see your follower count climbing, it’s a good overall sign that your Twitter strategy is working. If it’s fallen, on the other hand, take note of potential causes and try to correct them.
3. Top follower
What it measures: The top follower of the month, with the highest number of their own followers.
Why it matters: While this person has not necessarily shared your content yet, they have the largest potential audience. That means your top followers hold the greatest potential to broaden the exposure of your tweets through retweets and comments.
You’ll likely want to follow back your top follower each month, and keep them on your radar for potential influencer and brand advocacy campaigns.
Bonus: Download the free strategy guide that reveals how Hootsuite grew our Twitter following to over 8 million users and learn how you can put the tactics to work for your business.
Get the free guide right now!4. Top mention
What it measures: The tweet with the most impressions of the month in which another Twitter user tagged you.
Why it matters: Take a close look here—is this a positive mention or a negative one? If it’s a positive mention or content share, be sure to thank the person and keep them on your radar for future collaboration. After all, they expanded your reach more than any other Twitter user this month.
If it’s a negative mention, reach out to the person to see what you can do to repair the relationship.
Top tweet metrics
After a high-level analysis of your account’s performance, these are the Twitter analytics you should focus on for your tweets.
You can view and track these metrics for individual tweets, or for all your tweets in a selected period of time.
5. Engagements
What it measures: Engagement is a count of how many times people interacted with your tweet. This includes everything from tweet expansion to retweets to likes to follows.
Why it matters: If you’re not getting engagement, you’re talking into a void. Tracking which tweets generate the most response is a good way to know what’s working for your brand.
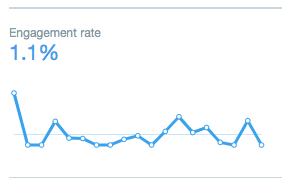
6. Engagement rate
What it measures: The number of engagements divided by the number of impressions a tweet receives.
Why it matters: While the number of engagements is a valuable metric in itself, engagement rate gives a clearer picture of how engaging a Tweet is because it also factors in how many people saw the Tweet.
When tracking engagement rate over time, watch for spikes or lows. Then dig into the individual Tweet statistics for those dates to see what you can learn about the types of content that inspires your audience to engage.
7. Twitter reach percentage
What it measures: How many of your followers saw any given tweet. You can calculate this yourself by dividing tweet impressions by your total followers.
Why it matters: This pretty much comes down to timing. Knowing how many of your followers are seeing your tweets is a good indicator of whether or not you’re tweeting at the right times. This can also help you plan a strategy for reporting the same content in different ways to maximize exposure.
You may find that a tweet actually reaches more people than you have on your follower list, giving you a percentage higher than 100. This means non-followers found you, likely through a retweet, comment, or hashtag. Check these tweets carefully to see what worked so well.
8. Link clicks
What it measures: The number of times Twitter users clicked on a link or website card in your Tweet.
Why it matters: While link clicks are factored into engagement rate, you might also want to track clicks on their own. After all, this is engagement that moves beyond Twitter itself, with people choosing to interact with your brand content or products.
Top Twitter ads metrics
9. Results
What it measures: Results are the desired actions tied to your ad’s customizable objective. Twitter ad results can track a range of objectives, including impressions, followers, engagements, video views, website clicks and conversions, and more.
Why it matters: This is the essential metric for determining whether or not your ad is delivering on the desired outcome of your Twitter campaign. The result is directly tied to the objective you set for the ad. So, for example, if you choose website visits as your goal, the result number tracks link clicks.
10. Cost per result (CPR)
What it measures: An average of how much you pay for each relevant action users take after seeing your ad.
Why it matters: Each campaign objective is tied to a billable action that’s only charged when the action occurs. For example, if your campaign objective is video views, you’ll only be charged when someone views your video. Tracking CPR will help you manage your budget and factor into your ROI calculations.
11. Conversions
What it measures: As Twitter explains, “Conversion tracking starts where Twitter stops.” Conversions allow you to track what actions people take on your website and across devices after they see your Twitter ad.
Why it matters: These figures will give you a sense of the path users take from your Twitter ad to your site, right through to conversion.
From your conversion tracking dashboard, you’ll be able to drill down into post-engagement and post-view conversions, transaction values and total sales. It’s where you’ll mostly clearly see where your tweets deliver on ROI.
How to use Twitter analytics
In the Twitter Analytics dashboard
1. From your Twitter home page, click the three dots icon under your avatar, then choose Analytics from the menu.
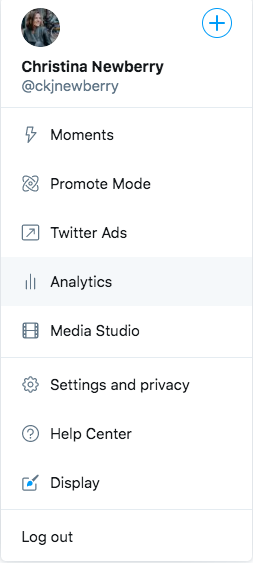
This takes you directly to your Account Home dashboard, where you can track the account metrics described above.
2. To access your Tweet Activity dashboard, click the Tweets tab in the top menu, or click View all Tweet activity under your top tweet.

From here, you can track the individual tweet metrics described above.
3. To access your Campaign dashboard, log into your Twitter Ads account.
In Hootsuite Analytics
1. Log into Hootsuite and click Analytics in the left sidebar.
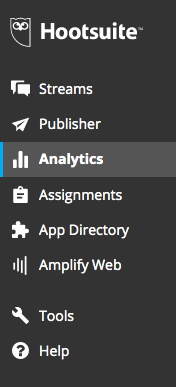
You’ll see an aggregate snapshot of your social profiles.
2. Select the Twitter icon in the upper left corner. If you manage multiple Twitter accounts, select the one you want to track. Then, choose the date range you want to analyze.
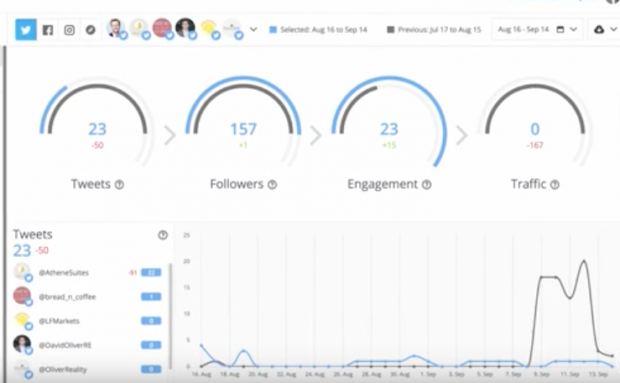
Here you can track tweets, followers, engagement, and traffic. The + or – number compares your custom date range with the previous or custom period and helps to measure account growth and identify trends.
3. Scroll down to find more detailed analytics, including engagement numbers for individual tweets.
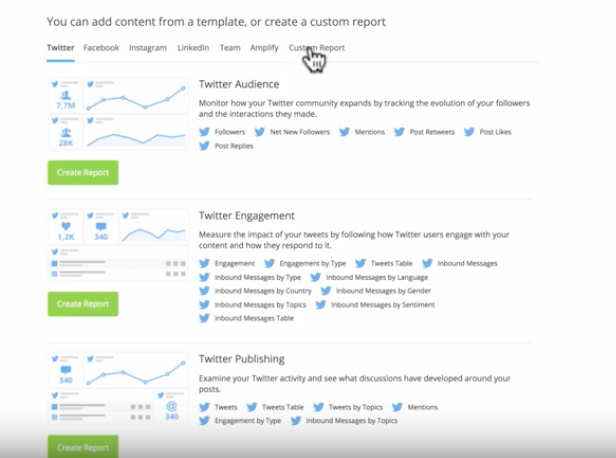
4. To track your Twitter metrics over time, click Reports. You can set up a custom Twitter analytics report with charts and graphs to monitor ongoing performance.
5. To drill down into the detailed Twitter metrics for individual posts, click Post Performance.
Twitter analytics tools
Twitter analytics and Hootsuite Analytics give you great insights into your Twitter performance. Here are some additional tools you might want to consider adding to your Tweet tracking arsenal.
1. TweetReach
TweetReach is a great tool to estimate and benchmark against competitors. Its snapshot reports track estimated reach, impressions, and other analytics based on username searches. Reports rely on social intelligence from Union Metrics (an official Twitter partner), so you know it’s legit.
2. SocialRank
SocialRank helps you identify your top followers in terms of engagement and value. It’s a good Twitter analytics tool to help identify potential advocates and influencers.
3. BrandMaxima
BrandMaxima allows you to analyze the performance of your Twitter account and branded hashtags, then benchmark against the competition.
4. Cloohawk
Cloohawk analyzes your Tweets and followers to identify potential actions to improve your results.
5. Tweepsmap
Tweepsmap helps you analyze your Twitter audience. The Twitter metrics provided include best times to tweet, Twitter engagement, follower growth, and most influential followers.
6. Twitonomy
Twitonomy provides analytics of your own Twitter accounts or someone else’s, so you can check out the competition.
Want more tools? We’ve got a whole post on Twitter tools to help hone your strategy.
Gain insight into your Twitter performance—and the performance of all your other social media platforms—with Hootsuite Analytics. Try it free today.
The post How to Use Twitter Analytics: The Complete Guide for Marketers appeared first on Hootsuite Social Media Management.
Contributer : Hootsuite Social Media Management https://ift.tt/2iJbgBm

 Reviewed by mimisabreena
on
Tuesday, August 27, 2019
Rating:
Reviewed by mimisabreena
on
Tuesday, August 27, 2019
Rating:


No comments:
Post a Comment