


What are typical average add-to-cart conversion rates?
A comparison benchmark of add-to-basket rates with conversion rates? [Chart of the Day]
Do you call it add-to-cart or add-to-basket? It depends where you are based - cart is most common in the United States, basket is more common in the UK and Australia.
Regardless of what you call it, adding an item to the cart is an important micro-conversion step to measure and benchmark for retailers. While it is common to compare conversion rates, naturally this measures the efficiency of the overall process including both category or product views, basket adds and checkout.
Add-to-basket rates give additional information about how appealing individual products are based on description and visuals on the product page. It shows intent to purchase by interactions with the site (Act in the Smart Insights RACE Planning conversion funnel). Google has several definitions in its Enhanced Ecommerce tracking and they neatly avoid the use of basket or cart. These measures include:
- Product Adds (to carts)
- Product Removes (from carts)
- Cart-to-Detail Rate (number of products added per number of product-detail views)
Of course, the overall conversion may take place over several sessions in practice.
What is an add-to-cart conversion rate?
As with all KPIs, we have to be careful to define add-to-basket rates since it can vary by the type of analytics system you're using. As with Ecommerce conversion rates, it can be stated as the ratio of adds to visitor sessions or unique visitors. Because of the difficulty in identifying unique visitors, it's common, as with Google Analytics to measure conversion to visitor sessions. We also have to think whether it's based on views of the basket or cart rates, or clicks on the button. Since it's easier to measure clicks, it's generally the case that it's based on button clicks, but that does vary by system.
So we can define add-to-cart conversion rate as:
The percentage of visitors sessions to a website that involve a click on the add-to-cart or add-to-basket buttons.
Average add-to-cart rates by device
Unfortunately Google doesn't publish average add-to-cart rates, but fortunately there is a good source in the regularly updated Monetate Ecommerce research benchmarks.
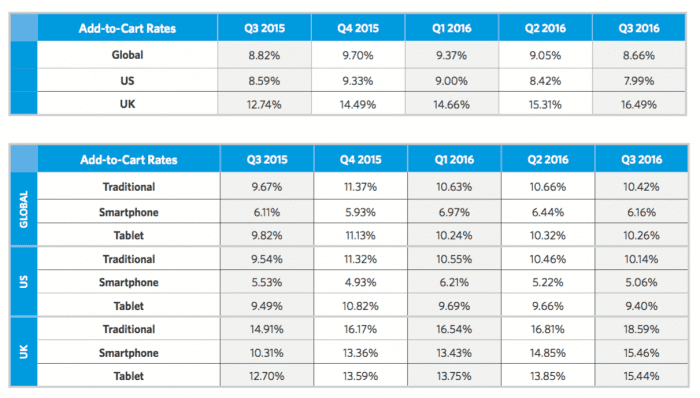
The most recent compilation from Monetate shows that:
- The average add-to-cart rate is 8.7% (amongst their customers)
- Add-to-cart is significantly lower on smartphone (6.2%) compared to desktop (10.4%)
- Tablet rates are similar, but slightly lower than desktop (10.3%)
- Conversion rates overall are at roughly one third of this rate (2.5% in Q3)
The much lower add-to-cart rate on smartphone compared to desktop is similar to the pattern for conversion rate. Why is this? Well it has to be a combination of user preference to purchase on desktop and usability challenges on smartphone. Perhaps the difference between the United States and UK in the chart shows how this can be optimised.
- Source: Monetate Ecommerce Quarterly research
- Sample: Q3 2016 averages from Monetate customers based on 1.9 billion shopping sessions
- Smart Insights toolkit: E-commerce retail toolkit
Contributer : Smart Insights


No comments:
Post a Comment