


25 Twitter Stats All Marketers Need to Know in 2020
Twitter statistics, we have them. Here are all the hard numbers you need to know if you’re planning to tap Twitter’s audience in 2020.
For some brands, Twitter might seem risky or divisive—though whether it causes or reflects political polarization is up for debate. But for those brands who ‘get’ Twitter, the rewards are many.
As with most established social media platforms, Twitter’s user growth has been evening out for a while. The result is a platform that’s been focused on improving user experience.
For instance, back in summer 2018, Twitter was purging third-party apps and deleting spam accounts. And in fall 2019, the company reported its work on ‘health’ (a.k.a detecting and removing abusive messages).
Despite all this, Twitter’s Q3 2019 earnings disappointed investors with “product issues” on its adtech, and a bummer of a summer for the big events and launches that would normally drive its ad sales.
But we aren’t looking to buy Twitter shares, we’re looking to market our brands. So how does all this shake out for brands looking to refresh their Twitter marketing strategy? There are a lot of good reasons to make Twitter one of your brand’s top channels.
Bonus: Download the free strategy guide that reveals how Hootsuite grew our Twitter following to over 8 million users and learn how you can put the tactics to work for your business.
General Twitter stats
1. Twitter has 145 million monetizable daily active users
That number is up 17% since Q3 2018, according to Twitter’s Q3 2019 report.
Note that these are specifically monetizable daily active users. That is, users who see ads. (In comparison, Facebook and Snap report all their DAUs, even those who don’t necessarily see ads.)
If this number seems low to you it might be because Twitter used to measure its user population by monthly active users. For instance, in Q1 2019 the company stated it had 330 million monthly active users.
At the end of the day, Twitter’s user base is growing, and the company is making an effort to be transparent with advertisers about those numbers.
2. Twitter’s U.S. user base is predicted to grow 0.3% in 2020
By many accounts, including eMarketer’s predictions, the days of massive user growth are over for the big social media platforms.
The bright side of saturation, however, is that Twitter knows it has to offer value and produce a product that users and advertisers love. Expect a continued focus on quality over quantity, in 2020.
 Source: eMarketer
3. 30 million (or 20%) of Twitter’s daily users are American
And according to Statista, 49 million Americans make up 15% of monthly users, worldwide. That makes Americans the largest percentage of Twitter’s user base.
Japan and the U.K. are the company’s second- and third-biggest marketers.
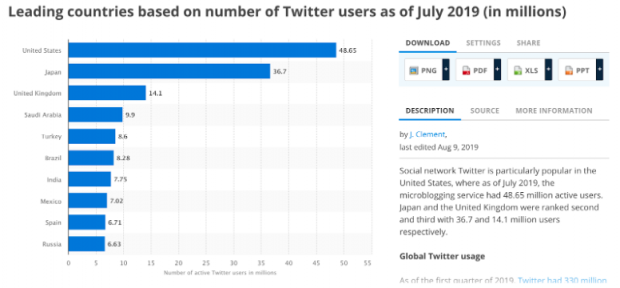 Source: Statista
4. 92% of the U.S. population is familiar with Twitter (even if they don’t use it)
Twitter has never been as vast as the other major platforms, but it consistently plays an outsize role in media and culture.
Why? Twitter is key for people whose jobs involve thinking and communication. Politicians, poets, celebrities, journalists, comedians, football writers, astrologists, activists, and librarians (ok, that’s just my personal feed) all use Twitter as a crucial part of their work. Which means its also a crucial platform for their audiences.
Also, as every local newscaster knows, Twitter is an endless font of hot takes. (And also: great entertainment).
Twitter user stats
5. 22% of adults in the U.S. use Twitter
According to Pew Research, this percentage has stayed relatively steady over the past few years. Although, it is a slight drop from 2016, when 24% of U.S. adults were on Twitter.
This performance is fairly consistent with the other big social media platforms. Facebook’s popularity dropped from 79% of U.S. adults in 2016 to 69% in 2019. Meanwhile, Instagram experienced the largest gain over that period, from 2016’s 32% to 2019’s 37% of U.S. adults.
6. 44% of U.S. 18- to 24-year-olds use Twitter
Compared to other age groups, it turns out Gen Z is most likely to be using Twitter. (By comparison, only 26% of 30- to 49-year-olds use Twitter.)
That said, Gen Z is still much more likely to be using YouTube, Facebook, Instagram and Snapchat.
Twitter is definitely more popular with Gen Z than Reddit, WhatsApp, LinkedIn, and Pinterest.
Here’s a full demographic breakdown:
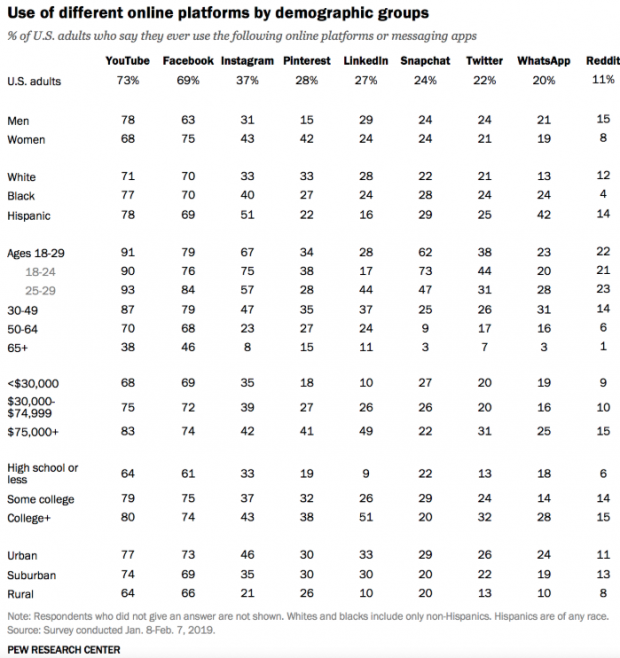 Source: Pew Research Center
7. U.S.-based Twitter users are younger, have more education, and more income than the general U.S. population
In terms of gender, race and ethnicity, Twitter user demographics mirror that of the general American population. However, the Pew Center found that they also differ in some key ways:
- The median age of U.S. Twitter users is 40, while the national population’s is 47
- 42% of U.S. Twitter users have a college degree, while only 31% of the national population does
- 41% of U.S. Twitter users report an income above $75,000, while only 32% of the national population does
8. American Twitter users are more likely to be Democrats than the average American
Twitter has a reputation as the most political of all the social media platforms. It’s used heavily by world leaders, for instance.
How does that look in America? According to Pew, 36% of U.S.-based Twitter users are Democrats, while only 30% of Americans identify that way.
Meanwhile, only 21% of Twitter users are Republican, though 26% of Americans identify that way.
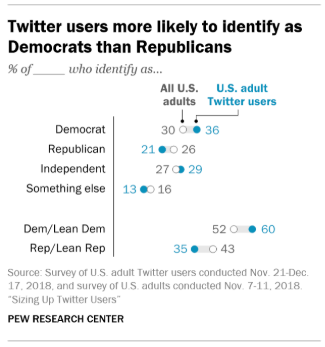 Source: Pew Research Center
9. In the U.S., Twitter’s most prolific 10% of users are likely to be women who tweet about politics
65% of Twitter’s top 10% of users (by tweet volume) identify as women. And 69% of this group say they tweet about politics.
Also, 61% of them identify as Democrats.
For a wider view on Twitter’s users, check out our in-depth breakdown of Twitter demographics.
Twitter usage stats
10. 80% of U.S. tweets come from 10% of Twitter users
(Yes, this is the 10% of users we mentioned in #9).
On average, a median user tweets 2 times a month, while the most prolific Twitter users tweet 138 times, according to Pew. (This doesn’t include ‘institutional’ accounts like businesses, organizations and other non-humans.)
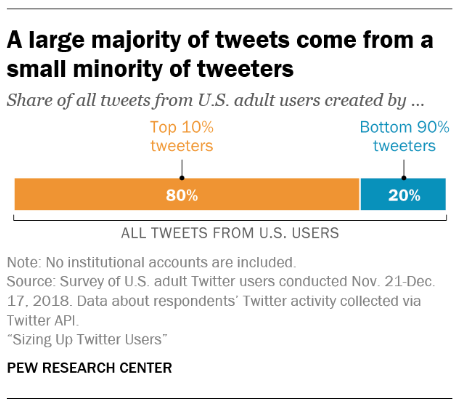 Source: Pew Research Center
11. The most active U.S. Twitter users have 20x as many followers, on average
Pew also notes that increased tweeting goes hand-in-hand with increased engagement in other ways: the most active accounts also have 70x as many favourites and 6x as many accounts followed.
Bonus: Download the free strategy guide that reveals how Hootsuite grew our Twitter following to over 8 million users and learn how you can put the tactics to work for your business.
Get the free guide right now!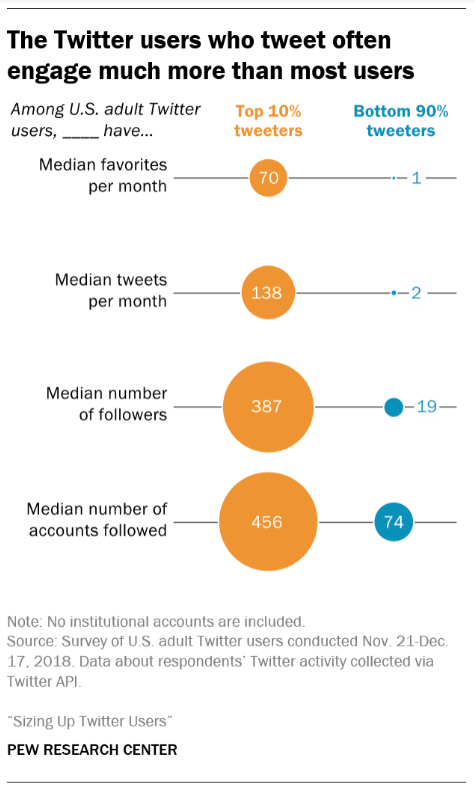 Source: Pew Research Center
12. 12% of Americans get their news from Twitter
This number looks relatively low (remember #5? 22% of the American population is on Twitter.)
Another way of looking at it, according to Pew: 71% of Americans on Twitter are using it to read news.
Meanwhile, 42% of Americans on Twitter are using it to discuss politics.
13. 13% of Americans on Twitter keep their accounts private
People with private accounts, according to Pew, tweet more often and favourite more tweets, on average. They are also more likely to be women.
Twitter stats for business
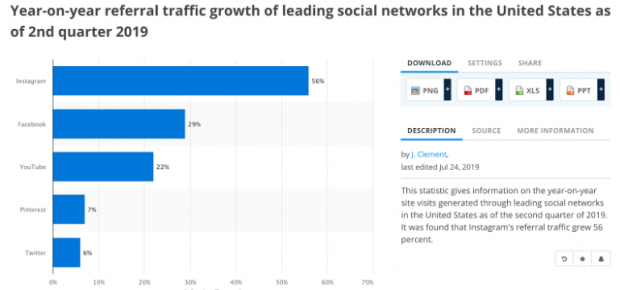
14. Twitter’s site referral traffic is up 6%, year-over-year
As of summer 2019, Twitter is in the #5 spot among social networks, outpaced by Instagram, Facebook, YouTube and neck-and-neck with Pinterest.
This number isn’t staggering, honestly. But does it mean that your Twitter marketing strategy might be better geared towards a KPI that isn’t click-through-rates? Or does it mean there’s room for innovation?
 Source: Statista
15. Twitter users are more likely to like brands that are inclusive and transparent
According to a recent study by Twitter and IPG, 50% of people think brands can become more culturally relevant by being inclusive, and that number rises to 60% among Twitter users.
The study also found that 47% of Twitter users prefer culturally relevant brands, compared to 39% of the general U.S. population.
Twitter advertising stats
16. Twitter ad engagement is up 23%
According to Twitter’s Q3 2019 report, users are increasingly engaging with ads on Twitter. Simultaneously, Twitter says that the CPE (cost per engagement) is down 12%.
Twitter points to improved click-through rates and audience growth for these numbers.
If your Twitter marketing strategy could benefit from what looks like cheaper and more engaging ads, you might want to check out our guide to using Twitter ads.
17. Twitter ads with video are 50% cheaper in cost-per-engagement
Good video does good work, and can save you ad budget.
18. Twitter users spend 26% more time with ads than other social media users
Twitter users have been shown to linger over ads. Is this because they’re more engaged and curious? Twitter calls itself the #1 platform for discovery, after all.
19. Twitter users spend 24% more time with ads posted by ‘creators’
This stat comes from Twitter Arthouse (the platform’s in-house influencer agency).
Does your social media influencer marketing strategy include Twitter? Depending on your brand, it might be worthwhile to look into it.
Twitter publishing stats
20. 25% of Twitter’s most prolific users use scheduling software
According to Pew Research, the top 10% of Twitter’s users (in terms of activity) are more likely to automate their Tweets. And 15% of Twitter’s other 90% of users use scheduling.
If you’re aiming to crack 138 tweets per month, we have some guidelines on how to schedule tweets.
21. Tweets with hashtags gets 100% more engagement
But, pro tip from Twitter: use only one or two because if you use more, engagement declines again.
Twitter video stats
22. People watch 2 billion videos on Twitter per day
That’s 66% year-over-year growth in 2019. Video has definitely found its place on Twitter.
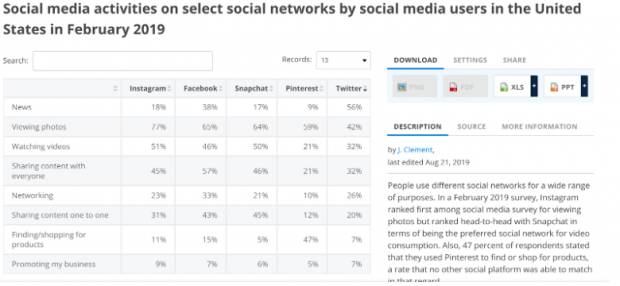
23. Watching video is the #3 reason people use Twitter
32% of people on Twitter say they go to Twitter to watch video. As an activity, it ranks after news and photos. (And may I just say, once again: #ripvine.)
 Source: Statista
24. Tweets with video get 10x the engagement
Engagement includes likes, retweets and comments. Enough said?
25. 93% of video views on Twitter happen on mobile
This is according to Twitter’s internal data. Remember to post mobile-optimized video that has subtitles or captions for sound-off viewing.
Save time managing your Twitter presence by using Hootsuite to share video, schedule posts, and monitor your efforts. Try it free today.
The post 25 Twitter Stats All Marketers Need to Know in 2020 appeared first on Hootsuite Social Media Management.
Contributer : Hootsuite Social Media Management https://ift.tt/2h678b8

 Reviewed by mimisabreena
on
Thursday, October 31, 2019
Rating:
Reviewed by mimisabreena
on
Thursday, October 31, 2019
Rating:


No comments:
Post a Comment