


Ecommerce conversion rates
Our compilation comparing average conversion rates for retail sites and other industry sectors
As you will know, conversion rate is often used as a KPI to review the effectiveness of Ecommerce sites. Naturally all site managers and owners want to know, "how do our conversion rates compare?"
In this post I have compiled different free industry sources focusing on retail Ecommerce conversion, but towards the end of the post, a chart shows average conversion rates for a range of sectors including B2B conversion.
Before we get to the stats, one other caveat on analysis of conversion rates:
When benchmarking conversion rate, we think it's important to explain to marketing managers that they should go beyond headline conversion rates to segment conversion by different types of visitor.
To see why, see Dan Barker's excellent post explaining why conversion rate is a horrible measure to focus on...
August 2017 update - lead generation conversion rates by device
If you work in non-retail sectors like B2B, travel or financial services benchmarks of lead generation conversion can be hard to come by. In this update, at the end of this article we feature an analysis of Unbounce landing page conversion by sector.
March 2017 update - retail conversion rates by device
The Monetate Ecommerce Quarterly is a great source giving regularly updated benchmarks on conversion segmented by devices and media for large Ecommerce brands.
Rob created the chart below on the latest ecommerce conversion rate data by device from the Q4 2016 data released by monetate in January 2017.
Their latest quarterly update from January 2017 shows conversion rates to add-to-basket or cart and below sale across the last 5 quarters, up to Q4 2016:
| Conversion Rates | Q4 2015 | Q1 2016 | Q2 2016 | Q3 2016 | Q4 2016 |
|---|---|---|---|---|---|
| Global | 3.26% | 2.94% | 2.76% | 2.76% | 2.95% |
| US | 3.24% | 2.89% | 2.72% | 2.44% | 3.00% |
| UK | 5.24% | 5.01% | 4.64% | 4.35% | 4.45% |
| Conversion Rates by Device | Q4 2015 | Q1 2016 | Q2 2016 | Q3 2016 | Q4 2016 | |
|---|---|---|---|---|---|---|
| Global | Desktop | 4.21% | 3.84% | 3.69% | 3.42% | 4.14% |
| Smartphone | 1.35% | 1.41% | 1.38% | 1.21% | 1.55% | |
| Tablet | 3.74% | 3.24% | 3.18% | 2.94% | 3.56% | |
| US | Desktop | 4.28% | 3.87% | 3.75% | 3.51% | 4.31% |
| Smartphone | 1.20% | 1.29% | 1.27% | 1.11% | 1.50% | |
| Tablet | 3.68% | 3.08% | 3.03% | 2.79% | 3.55% | |
| UK | Desktop | 6.89% | 6.71% | 6.25% | 5.77% | 5.96% |
| Smartphone | 3.46% | 3.32% | 3.17% | 3.15% | 3.31% | |
| Tablet | 5.12% | 4.83% | 4.64% | 4.46% | 4.52% |
With shoppers increasingly using smartphone and tablet to purchase, it's vital for online retailers to know the effectiveness of trading via these platforms.
This compilation of retail orders by device type from September 2016 from another source - the Custora Ecommerce Pulse shows the impact of lower conversion rates on smartphone on the level of sales by online channel which is currently 67% desktop and 33% mobile (24% smartphone, 9% tablet).
Mobile retail conversion rates
This new report from the Adobe Mobile retail report has a simple table comparing cart and visit (overall) conversion on smartphone vs tablet vs desktop. It shows that visit conversion is nearly 3 times higher on desktop vs smartphone.
- Location: US
- Date: October 2016 (2016 data)
- Sample: Top 100 retailers (so representative of common consumer behaviour)
- Source: Adobe Mobile retail 2016 report
If you're creating a business case for mobile optimised sites as explained in our Ecommerce mobile and desktop wireframes guide or mobile marketing strategy guide, this data is also valuable since it shows the variation in conversion rate by mobile devices type. Tablet conversion rates are similar, but slightly lower than desktop conversion rates, suggesting people are increasingly comfortable with the experience of buying on tablets.
However, it's a different story for Smartphones since these convert at one-third to one-quarter of the rate of traditional or tablet devices.
This suggests smartphones are more of browse or research platform rather than a buy platform since many of the large retailers featured in this survey will have mobile optimised sites. Smartphone experiences should be personalised to show this different form of usage. The lower conversion rates for mobile devices are also shown in these compilations of Android vs MacOS vs iOS operating systems, which gives the latest 4th quarter data released in early 2017.
Conversion rates by channel
Conversion rates for other sectors: telecoms and travel
These are available in the Adobe Digital Index (ADI) - this data is available in the April 2016 published data for the whole of 2015.
Conversion rates for US vs Europe vs Asia Pacific for the travel industry
The ADI report also compares conversion for EMEA countries against the US. UK and US conversion are significantly lower than other European countries perhaps because of less competition or Amazon being lower in these countries. Different rates of smartphone adoption will also affect this cross-platform average.
UK average conversion rates from IMRG
With the acquisition of retail analytics service Coremetrics by IBM we lost one of our best free sources for comparing conversion rates. Within the UK data is compiled for members by retail category. These aren't shared any longer, so this is dated. This chart shows that average conversion rates for visits to sale of 4 percent. Note that these are typically for large brands, so conversion rates for less well-known brands that don't have the credibility, trust or large base of returning customers will generally be lower. Based on previous UK compilations from Coremetrics when their data was published we can say that typical average conversion rates for established retail brands are...
Conversion rate (visit to add to basket): 8% Conversion rate (visit to sale): 4%
It's interesting that there is a typical 50% abandonment from basket through checkout to sale, even with the efforts on checkout optimisation. It suggests many will add to basket when researching and comparing, but may eventually buy elsewhere online or offline. This is a screengrab of the Coremetrics data from 2009 which shows that visitor sessions with an add to basket or cart are typically double those of order or sale sessions. The much more recent Monetate earlier in the post also shows this. We have retained this since it shows the increase in conversion if you can encourage a visitor to search.
Options for segmenting conversion rate
As Dan Barker suggests in his advice we mentioned at the start of this post, conversion rate gets more useful as you break it down by different types of visitors with different intent and a different relationship with the retailer. Different conversion rates and average order values can then be segmented for different audiences to understand and work to improve the quality of traffic or strength of propositions, for example:
- First time, repeat visitor or registered customer conversion
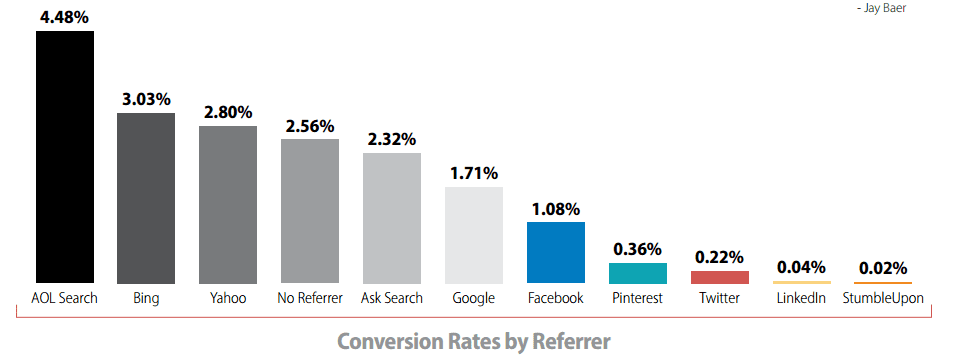
- Referring channel conversion, e.g. paid or natural search, social media, affiliates, display advertising
- Search type, e.g. paid or natural, brand, generic or long-tail
- Product category type - conversion rates are much higher for simple commodity products for example - flower purchase (double digit percentage) compared with a higher cost product that will often be purchased in store (for example beds or furniture which will often be less than one percent).
- Promotion type or seasonal sale - the IMRG data and Coremetrics data below shows that conversion rate can increase dramatically at these times.
Conversion rates for non Ecommerce sites including B2B conversion
I'm also often asked about conversion rates in other sectors, particularly for business-to-business lead generation. While similar caveats about sub-category, type of visitor and strength of brand apply, this is a useful compilation from this older Marketing Sherpa of average conversion rates by industry sector.

The chart shows wide variation within and between sectors with some businesses achieving lead generation conversion rates much higher than the media. So, to compare against your rates it's best to look at the media rates which vary between 2.8% and 6%.
Contributer : Smart Insights


No comments:
Post a Comment